|
Introduction - The Purpose of This Software
|
The Flexible Income Stream is a powerful sales tool for insurance professionals who use annuities
to provide a safe, guaranteed, tax-preferred income stream for their clients.
IMPORTANT DISCLOSURES PERTAINING TO THIS SOFTWARE
- ImagiSOFT updates annuity product interest rates, state approvals, surrender charges on a best-effort basis.
- The software will ask for an Internet Connection if an Internet Update has not been performed within 7 days. If you are traveling with a laptop, be sure to perform an Internet Update before using this software with a client.
- the calculations and illustrations presented are not guaranteed or officially approved by the companies illustrated.
- None of the calculations shown in this software are legally binding nor has this sales concept been approved by any regulatory or state governing body.
- All products named in this illustration must be accompanied by official company illustrations, brochures and/or disclosures.
The Flexible Income Stream compares the income and taxation of an existing account that you enter
on the Account Tab
with several immediate, traditional, and fixed indexed annuities that you select on the Split Tab.
The Summary Tab gives you a quick overview of the values of the Existing Account with the Annuity Income Strategy:
|

All the information you need to make the sale is on the above Summary Tab
- Existing Account: $4,000 interest, less $1,000 taxes = $3,000 After-tax Income
- Existing Account: $45,000 after-tax income after 15 years
- Annuity Product Strategy: $4,382 annuity payout, less $110 taxes = $4,273 after-tax Income
- Annuity Product Strategy: After-tax income increases to $4,921 in year 5, and to $5,679 in year 10
- Annuity Product Strategy: $74,367 after-tax income after 15 years
- Existing Account: Income is guaranteed for the duration of the certificate of deposit, 3-7 years
- Annuity Product Strategy: Income is guaranteed for 15 years
The Annuity Product Strategy produces nearly $30,000 more after-tax income, with more certainty, with comparable safety.
Back to top
|
|
|
Common Mistakes When Selling Annuities
|
1. Selling accumulation values, instead of a safe, guaranteed income.
One reason the SEC ruled that
Fixed Indexed Annuities become securities in 2011
is because too many agents sold these products like securities.
Potential growth is only a part of the story, and by over-emphasizing this
feature, agents attracted a lot of negative
publicity, lawsuits, and disciplinary actions for unsuitable sales. You will avoid trouble for yourself and your insurance company
by focusing your sales presentation on the following product features:
- Income
- Guarantees
- Interest Rates
- Accumulation Values
- Income Duration, Especially Lifetime Income
- Safety
- Tax Advantages
Yes, accumulation values are part of the story, but should not be the focus of your presentation.
See Annuity Agents May Be Telling the Wrong Story for more information on this subject.
2. Forgetting to explain the tax benefits.
Non-qualified annuities enjoy the benefits of triple compounding. They receive interest on:
- the principal
- the interest
- the taxes the annuitant would have otherwise paid on the interest earned
The summary screen below shows the power of triple compounding. After only 10 years, the Annuity Product Strategy
provides $9,639 annual after-tax income from the original $100,000. This is more than twice the $4,032 annual
after-tax income provided by keeping the money in the certificate of deposit.

Remember the real story is about after-tax income not income.
3. Putting all your client's eggs in one annuity basket.
On the surface it may appear that putting all of your client's money into a single fixed indexed annuity,
generating a guaranteed lifetime income, and earning the highest commission is the perfect solution. However,
there several factors you should consider before taking this approach:
- Suitability Laws. See
Can You Afford a $78,000 Commission Charge-back? to see why a multiple annuity strategy may be better for you
and your client.
- Less Competitive. A well-structured annuity portfolio developed with the Flexible Income Stream
software will often generate higher after-tax income than a single fixed indexed annuity with a guaranteed
lifetime income rider. See
Which Income Plan Is Better? for details.
- Lower Commissions. A one-time deposit into a fixed indexed annuity generates a one-time commission,
but the Flexible Income Stream schedules additional future commissions for the agent. See
When is 3% Commission is higher than 8%?
for details.
In short, use the Flexible Income Stream software to help your client achieve a high, after-tax income.
Back to top.
|
Frequently Asked Questions
|
Q: Why can't I illustrate higher than 5% interest on fixed indexed annuity products?
A: We believe that running anything higher than 5% interest may give your customer unrealistic expectations as to what an indexed annuity is capable of delivering.
Consider this: The best historical 10 year period for an indexed annuity will
normally have two "zero percent interest" years; the worst 10 year period will have six. Assume an 8% cap on the index.
In simple terms, the "best" scenario is approximately 8% times 8 years = 64%, divided by 10 years, for an average return of 6.40%. If the index returns "zero percent interest"
in 5 out of 10 years the product would return about 4.0% interest. We know that this
explanation is oversimplified, but it helps to explain why we protect agents by preventing our software from
illustrating exaggerated interest rates on fixed indexed annuities.
You may find this spreadsheet useful to
see the interest rates that annual point-to-point products may
deliver over time. Always emphasize the underlying
guaranteed interest rates. It is possible for fixed indexed annuities to deliver next to nothing. Examine this graph that illustrates
a 3% Monthly Sum strategy based on a historical January 1, 1973 date. During this 10 year period, this strategy would have returned a paltry .43% hypothetical annual interest rate, which
is $20,000 less than the underlying guaranteed interest rate!
A product with a 100% participation rate, 0% spread, and an 8% cap will never deliver higher than an 8% interest rate.
Why would you want to illustrate an interest rate that is highly unlikely to happen?
Q: The insurance company guarantees 8% interest on the guaranteed income rider account. Why can't I show an 8% interest rate?
A: You are confusing the guaranteed income rider account with the indexed account. These are separate accounts. The indexed account
has the money the client can withdraw, whereas the guaranteed income account determines how much the client can withdraw. For a detailed
discussion about income riders and how they work see The Cost of Guaranteed Lifetime Income Riders
and Don’t Be Confused By Guaranteed Income Riders.
Agents who ask the above question should not sell income riders until they understand exactly how they work.
These income riders, if they go unused, will cost your clients thousands of wasted dollars. On the other hand, if future interest
is credited to the indexed account at an extremely low rate, these riders may be a godsend.
Q: In the summary below, why is the Account Balance of the Annuity Product Strategy so much lower than the Account Balance of the Existing Account?
A: In this case the Annuity Product Strategy is composed of four different annuities:
- $21,950 - 5 Year Single Premium Immediate Annuity with a surrender value of $0
- $21,024 - 5 Year Guaranteed Interest Annuity with a surrender value of $20,342
- $21,950 - 10 Year Guaranteed Interest Annuity with a surrender value of $20,755
- $35,075 - Fixed Indexed Annuity with a surrender value of $32,701
Most of what appears to be a 26% first year surrender charge is actually the premium for the immediate
annuity that has a 5 year guaranteed payout. If the client would need 100% of their money in the next five
years, this Annuity Strategy is not suitable. Where this concept shines is in providing a higher, safe, guaranteed income.
By definition, this means the client must be willing to commit their principal for at least five years.

Back to top
|
Sales Ideas
|
Do You Want to Pay Uncle Sam, or Would You Rather Pay Yourself?
Many seniors have set aside some money for a “rainy day” that they hope they will never have to use.
Most of this money is in safe, fixed, taxable accounts such as bank certificates of deposit.
Let us assume the following situation: John Jones, age 70, has a $100,000 CD earning 4.00% interest.
Since John is in a 25% tax bracket, he pays $1,000 in federal income taxes, or “Uncle Sam,”
each year on this interest.
“If you could pay yourself that $1,000 per year, instead of Uncle Sam, and not sacrifice the growth you would have on the CD, would you do it?”
Most people will answer, "yes," to this question, but want you to prove that you can do it. The following will show you
what to enter into the Flexible Income Stream software fields to recreate this scenario.
1. Enter 25% in the Estimated Tax-Bracket field on the Assumptions Tab.

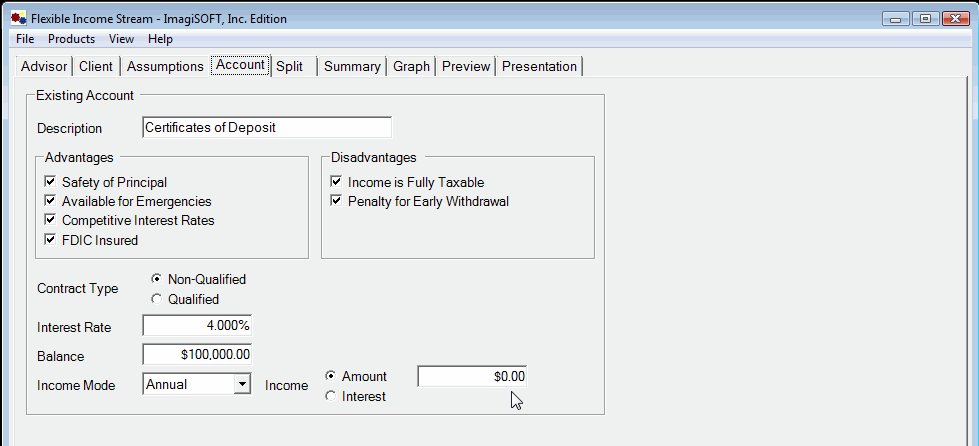
2. Enter the information for the client's existing account, a bank CD, as shown below on the Account Tab.
Notice that the amount of income that the client is withdrawing is "$0.00" because this 70-year old man is using this account
as a "stash" to be used only in the case of an emergency.
3. The Split Tab is where you build your Annuity Strategy. Remember, our 70 year-old man wants to keep most of his
money in an accumulation fund, but because of our door opener, "Do you want to pay Uncle Sam or would you rather pay yourself?"
we need to send him a small, annual paycheck. Enter the following information as shown below:

- Change the Income Mode to "Annual"
- Enter $1,000 into the Income Amount field
- Enter 2 in the Number of Periods field
- Enter 7 in the Years Per Period field.
- In the Immediate Annuity section press the "Best" button
- In the Deferred Annuity 1 section press the "Best" button
- In the Deferred Annuity section press the "Select" button and choose your favorite fixed indexed annuity from the list.
For this example we chose Great American's American Legend II product because it has a 7-year surrender charge, a high guaranteed interest rate, and a guaranteed lifetime income rider.
- Select "Match Account" in the Target box
- Press the "Find" button next to the Income Amount field
This strategy puts a 14 year foundation of guaranteed income to ensure that the indexed annuity has time to work.
By using a 7-year guaranteed interest rate product we guarantee the customer $1,094 per year for 7 years.
- The Immediate Annuity pays $1,094 at the end of each year for 7 years.
- The HorizonSelect-7 product is guaranteed to build over 7 years to $6,092, and will be used to purchase the same Immediate Annuity to generate income from years 6-10.
The indexed annuity is illustrated at a 4% interest rate (the philosophy behind this).
To ensure liquidity for the client, this indexed annuity has a 7-year surrender charge period and 10% free withdrawal provision.
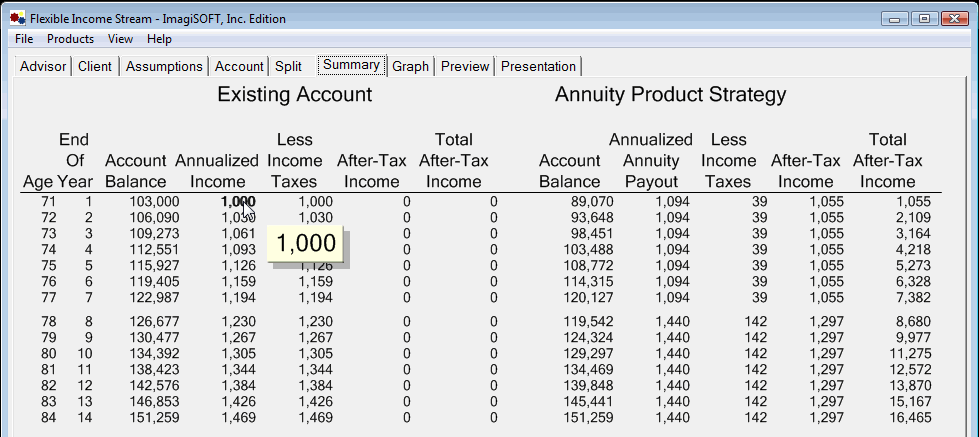
4. The Summary Tab shows the Existing Account earning $4,000 per year interest, with a $1,000 deduction
(or higher) each year for taxes, to pay "Uncle Sam." Taxes in the annuity are deferred so there is no need to
make a withdrawal to pay taxes. However, we withdraw $1,094 each year and pay $39 in taxes so that the client can
"pay himself instead of Uncle Sam." One creative agent looked the wife in the eye and said, "If you want, I will schedule
this $1,000 to arrive about the same time as your wedding anniversary so you and your husband can spend a nice weekend together."
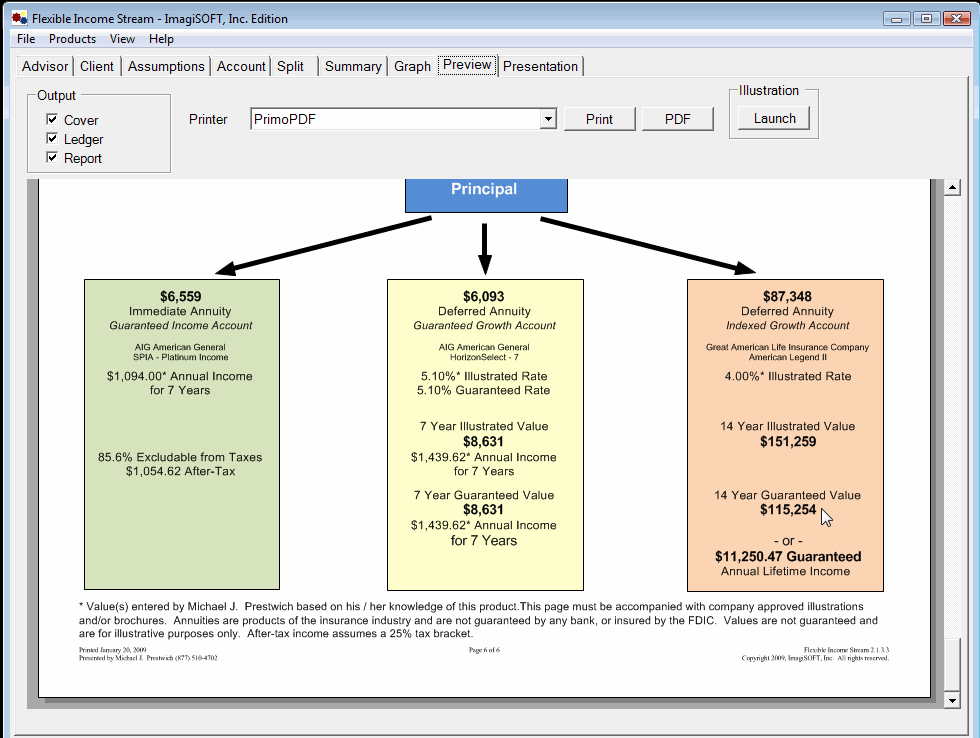
4. The last page of Preview Tab shows the names of each company, the product name, the income amounts, the illustrated values, and the guaranteed values.
All of these elements are required by most states to comply with state advertising laws. Notice that the guaranteed cash value has equal prominence with
the 4.00% illustrated value, as required by most state insurance departments. If the indexed annuity has an income rider, the Guaranteed Annual Lifetime Income is also shown.
How Much Could Income Taxes Rise in the Future?
President Obama has proposed an income tax increase and has the full support of Congress.
Current tax rates for 2009 and 2010 are as follows:
|
Married, Filing Joint Return
|
Single Filers
|
|
Tax Year
|
Taxable Income
|
Tax Bracket
|
Tax Year
|
Taxable Income
|
Tax Bracket
|
|
2009 -2010
|
$0 to $16,700
|
10% |
2009-2010 |
$0 to $8,350
|
10%
|
|
2009 -2010
|
$16,700 to $67,900
|
15% |
2009-2010 |
$8,350 to $33,950
|
15%
|
|
2009 -2010
|
$67,900 to $137,050
|
25% |
2009-2010 |
$33,950 to $82,250
|
25%
|
|
2009 -2010
|
$137,050 to $208,850
|
28% |
2009-2010 |
$82,250 to $171,550
|
28%
|
|
2009 -2010
|
$208,850 to $372,950
|
33% |
2009-2010 |
$171,550 to $372,950
|
33%
|
|
2009 -2010
|
over $372,950
|
35% |
2009-2010 |
over $372,950
|
35%
|
President Obama's proposal would:
- Increase the 33% tax bracket to 36%
- Increase the 35% tax bracket to 39.6%
- Increase the tax on investment income to 20% instead of the current 15%
- Lower the maximum deduction for itemized deductions to 28%
If President Obama follows Franklin Delano Roosevelt's lead, these tax increases may be only the beginning
of a new wave of income tax increases. In 1932, and again in 1936,
when faced by budget deficits caused by the Great Depression, FDR increased the top tax bracket from 25% to 79%
(Source:
IRS Website).
When helping clients plan their future income, agents should discuss the possible income tax effect of this income,
and whether annuities can help reduce these taxes.
Can Your Client Reduce Taxes on Social Security?
Taxes on Social Security income is unavoidable for most
high income retirees. However it is possible for those
who have modest retirement income to avoid these taxes. Here is an overview:
- Married, Joint Return
- Tier 1: $32,000
- Tier 2: $44,000
- Single
- Tier 1: $25,000
- Tier 2: $34,000
If your client has defined benefit pension or other fixed income above Tier 2, they cannot avoid
paying taxes on Social Security. If they have no non-qualified money, they usually cannot avoid paying taxes
on Social Security without reducing their income.
However, here is an example of a married couple who filed a joint tax return and used annuities
to reduce their Social Security and ordinary income taxes
(2007 tax rates):
|
|
Before
|
After
|
|
Taxable Interest
|
$15,500
|
$500
|
|
Taxable Interest
from SPIA
|
$0
|
$1,000
|
|
Non-taxable Income from SPIA
|
$0
|
$13,000
|
|
401(k) Income
|
$40,000
|
$25,000
|
|
Social Security Income
|
($25,500 Taxable) $30,000
|
($4,750 Taxable) $30,000
|
|
Adjusted Gross Income
|
$81,000
|
$31,250
|
|
Standard Deduction
|
- $12,800
|
- $12,800
|
|
2 Exemptions
|
- $6,800
|
- $6,800
|
|
Taxable Income
|
$61,400
|
$11,650
|
|
Income Tax
|
$8,431
|
$1,168
|
|
After-tax Income
|
$77,069
|
$78,332
|
The above may look "too good to be true" but it is actually a simple, two-prong process:
- $500,000 safe assets generates $15,000 in taxable interest
- Use $65,000 to buy a 5-Year Single Premium Immediate Annuity to generate $14,000 income per year
- Put $385,000 in several deferred annuities to provide future income
- Leave $50,000 in a money market fund for emergencies
- The $40,000 this couple is taking from their 401(k) is higher than the Required Minimum Distribution (RMD) -- reduce it to $25,000
Smart agents will work with the client's accountant to work the above numbers and to create the ideal product mix.
The key is to get the taxable income as close to the Tier 1
income as possible. This has at least four advantages:
- The accountant's OK adds credibility to your sale
- The account will earn extra fee income
- If product suitability is ever an issue, you have the accountant as a friendly witness
- The accountant has other clients that need your help -- excellent referrals
In summary, this idea created a $65,000 SPIA sale, $385,000 in SPDA sales, and opened the door for an IRA rollover from the client's 401(k).
Back to top
|
|
Menus
|
|
File Menu
|
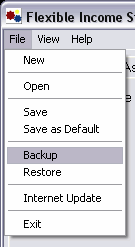
The file menu is designed mainly to open, save, and create new clients.
Explanation of the fields:
- New: Creates a new client.
- Open: Opens a previously saved client.
- Save: Saves current client's information in all tabs.
- Save as Default: Saves current Advisor and
Client information as the default preference. For example, if you typed the
city as "Albuquerque" in the Client tab and clicked "Save as Default", Albuquerque would be
pre-filled
for each new client created.
- Backup: Opens File Explorer where you can designate where to backup all stored client illustrations.
- Restore: Opens File Explorer where you can designate from where to restore client illustrations backup.
- Internet Update: To make sure that your products have the latest interest rates, click on Internet Update
each time you run it. Important: You must first establish an internet connection before using the Internet Update feature, and
you must perform an Internet Update at least every 7 days.
- Exit: Exits the program.
|
|
|
Back to top.
|
|
|
View
|
|
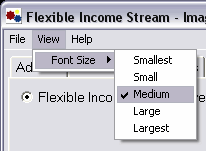
If you want to change the size of
the text within the illustration, click on View|Font Size, and choose
a size. The current font size will have a check next to it.
|
|
|
Back to top.
|
|
|
Advisor Tab
|
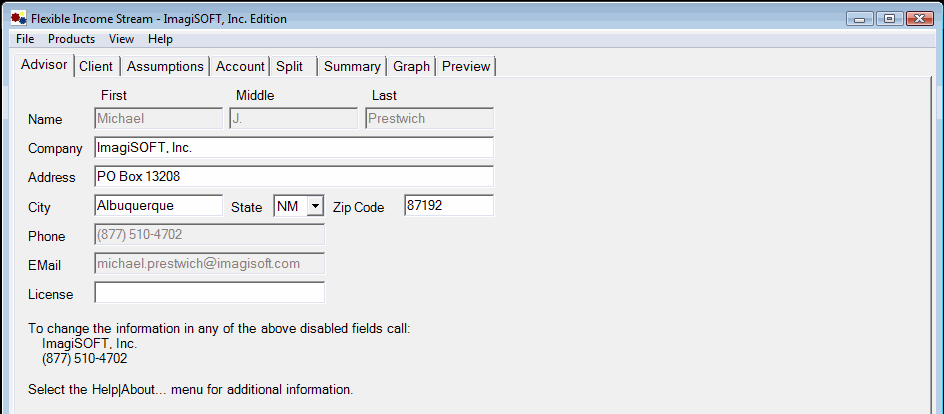
The Advisor Tab is where you enter your personal information that is printed in the report pages. Once you have filled
in this information correctly, select File|Save As Default to print your personal information on each report.
Think of this tab as your business card. Agents who leave these fields blank are missing an important opportunity
to keep their name in front of the client, and may be breaking state insurance
solicitation laws.
You can update information in these grayed areas by calling
IMAGISOFT at 877-510-4702.
The License field is used for California and Florida agents only.
|
|
|
Back to top
|
|
|
Client Tab
|
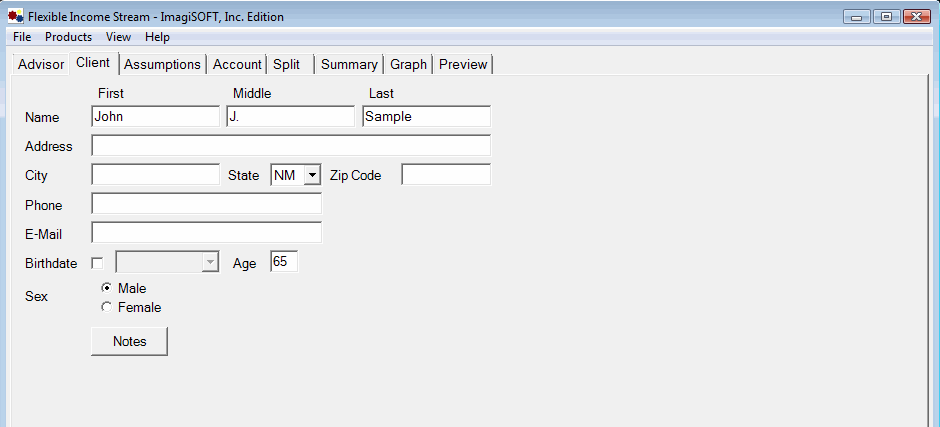
The Client tab is for your Client's name as it will
be printed on the report pages. Make sure your client's name is spelled correctly and uses correct upper and lower-case characters.
Using a name such as "valued client" will make you look foolish, and implies that your prospect is not "valued" and probably will not become a "client."
"Remember that a person’s name is to that person the sweetest and most important sound in any language." -- Dale Carnegie, How to Win Friends and Influence People
The Age and State fields are important because the software uses this information to determine which products you can sell to this client.
If the Birthdate field is checked, you can enter a birthdate for the client and the age will be calculated for you. If you
wish to enter your client's age instead, uncheck the Birthdate box, and fill in an age.The Notes button will open a notepad window so you can enter any additional information about the client.
For example, you may want to make notes about why certain products appealed to the client. |
|
|
Back to top.
|
|
|
Assumptions Tab
|
The Assumed Inflation Rate is for calculating increases in income if you select
later in the illustration to adjust future income for inflation.
The Estimated Tax Bracket is used to calculate the after-tax income that comes from the client's Existing Account and the Annuity Strategy.
Remember the old saying, "It is not how much you earn, it is how much you keep."
 Back to top
|
|
Account Tab
|
The purpose of the Account Tab is to "find the money." You cannot sell an annuity unless you know where the money is located, how it meets your client's needs for safety, income, guarantees, and rate of return.
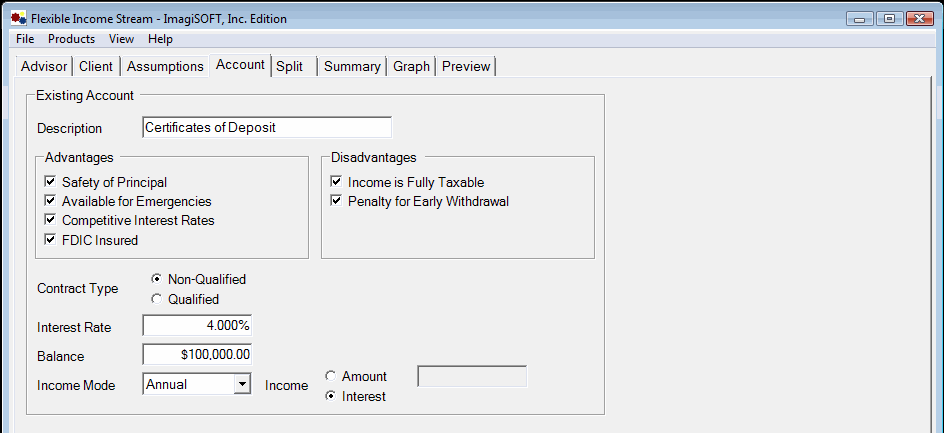
The Description field allows you to personalize this illustration for your customer.
The Advantages and Disadvantages check boxes will be added to the report based on your selections. These selections should reflect
the attributes of the client's current account. Don't be afraid to make the Existing Account look good - you
don't' want your customer to feel foolish
for choosing a poor account. This may cause him to become afraid to make the same mistake again - and cause you to lose a sale.
Select the Contract Type, either "Qualified" or "Non-Qualified" of the current account.
NOTE: Because of tax advantages, The Flexible Income Stream concept is much more effective in comparing current non-qualified accounts.
Enter the Interest Rate of the client's current account.
Enter the Balance of the client's current account.
If the client is taking current income from this account, enter the amount. Enter either "Monthly" or "Annual" in the Income Mode of the current account.
The Income Amount can be entered as a dollar amount or as Interest Only based on the Interest Rate of the current account.
Back to top
|
|
Split Tab
|
The Split Tab is where you develop your Annuity Product Strategy. It is the most important part of the software, and it is vital that you learn the features of this part of the software.
NOTE: The first time you run the software select Product Pool from the Products menu.

The Product Pool shows all the companies and their products that can be illustrated in The Flexible Income Stream software. Companies fall into one of two categories:
- Companies listed in black
use a generic calculator with results based on publicly available rates and products specifications.
- Companies listed in green
use an annuity illustration system developed by ImagiSOFT. These products are far more likely to be accurate
as to state approvals, issue ages, surrender charges, and guaranteed values. More importantly, you can generate an official, company-approved illustration of this product with very
little effort.
Check "off" the products that you are not licensed or have no desire to sell.

Install Software for Fully Supported Annuity Products
The following companies have contracted with ImagiSOFT to provide the illustration system for their
annuity products. Using these products with The Flexible Income Stream has several advantages:
- State approvals, issue ages, surrender charges, and guaranteed values will be accurate
- You can create company-approved illustrations with just a few keystrokes
- Products with guaranteed lifetime income riders are reflected on the report
Click the following links to install the software for the following
companies for which you are licensed to sell:
To install the software, click one of the above links, choose "Run," then
follow the instructions.
How to Build Your Annuity Product Strategy
Many agents are overwhelmed when they see the screen below. There are a lot of moving parts, but the concept is quite simple.
Here is a hypothetical situation and what you are trying to accomplish:
- Problem: John is 70 years old and is generating about $327 in monthly income from his $100,000 CD.
Since interest from a CD is fully taxable, assuming a 25% tax bracket, John receives $2,946 after-tax income annually.
John is also afraid that interest rates may drop (again) in the next five years, and his income will drop along
with it.
- Solution: Put John in two annuities; one to provide 10 years of guaranteed income, the other to
maintain his $100,000 principal. These annuities are guaranteed for 10 years. Step-by-step instructions follow below:
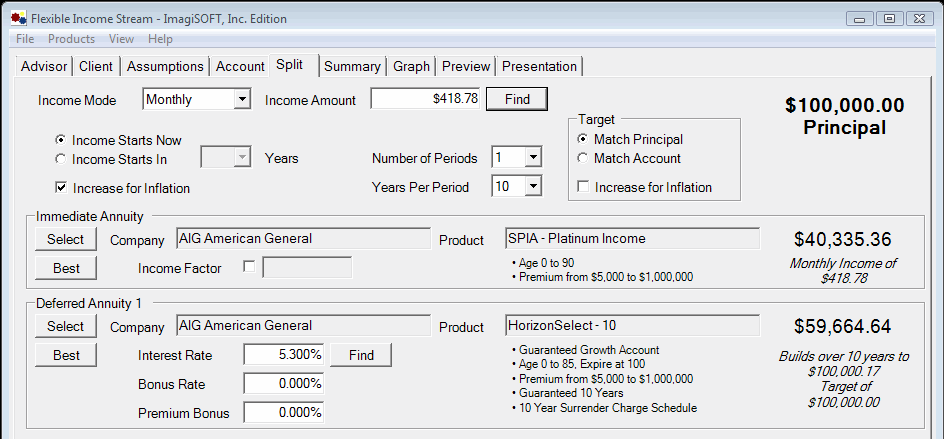
Income Mode: Select the income mode to "Monthly" to match how John receiving interest from his CD.
Income Amount: Enter the approximate monthly income the annuities will generate. Since the CD provides
$327 per month interest, enter this amount. Later you will click Find button to calculate the income
$418.78 shown on the screen above.
Number of Periods: We will start with the most simple Split Annuity, so enter "1." This means that the annuity strategy will consist of 1 Immediate Annuity and 1 Deferred Annuity.
Years Per Period: Enter "10" to indicate that you want to illustrate 10-year products. What you are doing is creating 1 income "ladder" or "bucket" that is 10 years long.
Immediate Annuity: Press the Best key.
This will choose a product based on the products that you have checked "on" in the Product Pool, that meet the issue age and premium requirements,
and that produces the highest income. If for some reason you do not want to use the product that the software deems to be the best, press the Select and
choose the product yourself.
Deferred Annuity 1: Press the Best key. The computer will choose the product that produces the highest guaranteed surrender value after 10 years.
Press the Select button if you would rather sell a different product.
Find the maximum amount of income that these two products will generate by pressing the "Find" button next to the Income Amount field. The result is $418.78.
Note: The right side of the screen shows how the $100,000 Premium is split between the two products.
- $40,335 into the Immediate Annuity
- $59,664 into Deferred Annuity 1
The right side of the screen also tells you that the Immediate Annuity provides $418.78 of monthly income and that
Deferred Annuity 1 will build to $100,000 in 10 years.
Click the Summary Tab to see the result:
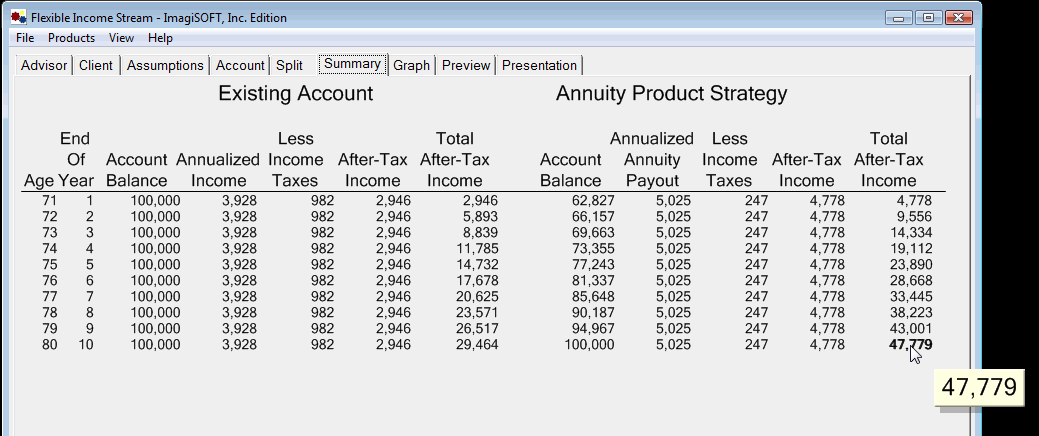
You have created a simple Annuity Strategy that will guarantee $47,779 of after-tax income over the next 10 years, as
opposed to $29,464 of non-guaranteed income from the CD. This solution solves the problem for 10 years until the client
is age 80, but what about after that? With a few changes you can provide the client with a guaranteed lifetime income.
How to Create a Guaranteed Lifetime Income Strategy
We will start by building from the above simple strategy. If you are not familiar with the details of the above case, click here.

Number of Periods: Enter "2" because this annuity strategy will have an Immediate Annuity and two Deferred Annuities.
Years Per Period: Enter "5" to indicate that you want to illustrate 5-year products. We are creating 2 income "ladders" or "buckets" that are 5 years each.
Immediate Annuity: Press the Best key to choose the 5 year immediate annuity that has the highest payout.
Deferred Annuity 1: Press the Best key. The computer will choose the product that produces the highest guaranteed surrender value after 5 years. This product will grow for 5 years
then will fund another 5-year immediate annuity. This is the second income "bucket."
Deferred Annuity 2: Press the Select key and choose and indexed annuity that has a guaranteed lifetime income rider. This final "bucket" will be used in 10 years, depending upon the growth
of this annuity and the client's circumstances, to provide a lifetime income, cash accumulation, or both.
Find the maximum amount of income that these three products will generate by pressing the "Find"
button next to the Income Amount field. The result is $386.57. This amount is lower than the 10 year product because we have the
"Increase for Inflation" box checked at the left. Examine the
Summary Tab:

The annuity product strategy generates $48,946 of guaranteed after-tax income after 10 years whereas the
CD produces about $29,464 non-guaranteed after-tax income. The last page of the
Preview Tab shows the options that our 70-year-old client has in 10 years at age 80:
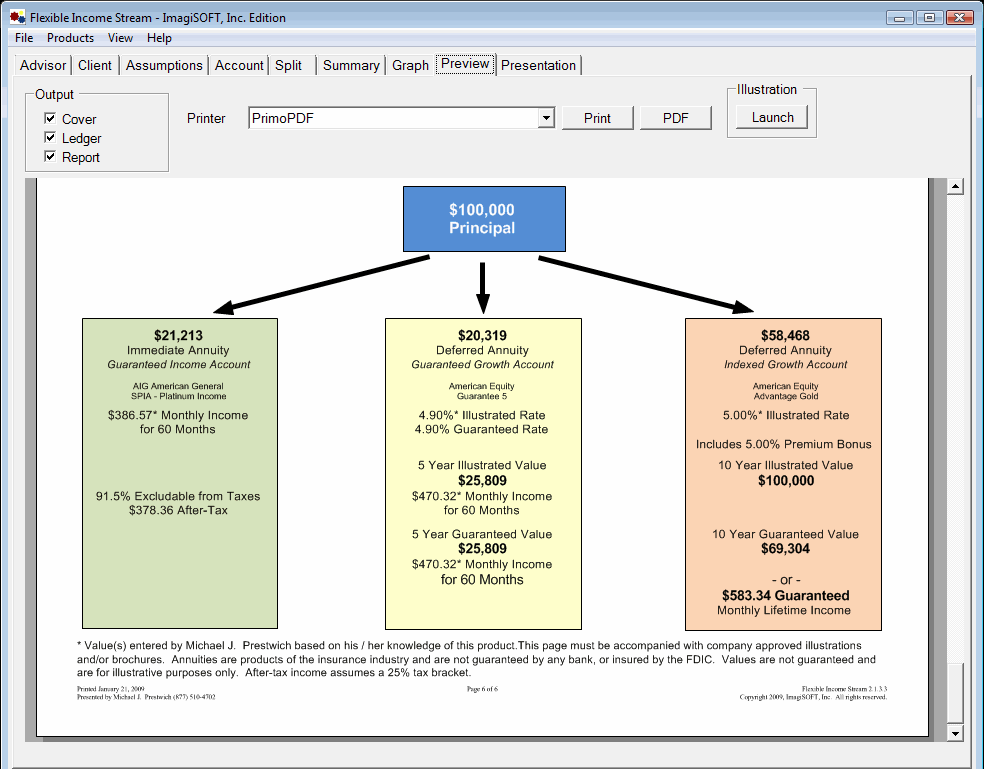
The third bucket, assuming a non-guaranteed 5% interest rate will "grow back" to the original $100,000 principal of the CD. However,
if the index returns a 0% interest rate each year for 10 years, it will "grow back" to $69,304.
The risk of the product returning only the guaranteed minimum
surrender value should be disclosed to the client. If the client is concerned about the possibility of having $30,000 less in his
guaranteed account, reduce the indexed annuity's illustrated interest rate from 5.00% to 2.50% then press
the "Find" income button. This will force more money to go into the index annuity bucket, and will increase the guaranteed cash value to $88,000.
Back to top
|
|
Graph Tab
|
The graphs illustrate the difference of the account balance and total income growth over the illustration period for the existing account and the split annuity
Flexible Income Stream strategy.
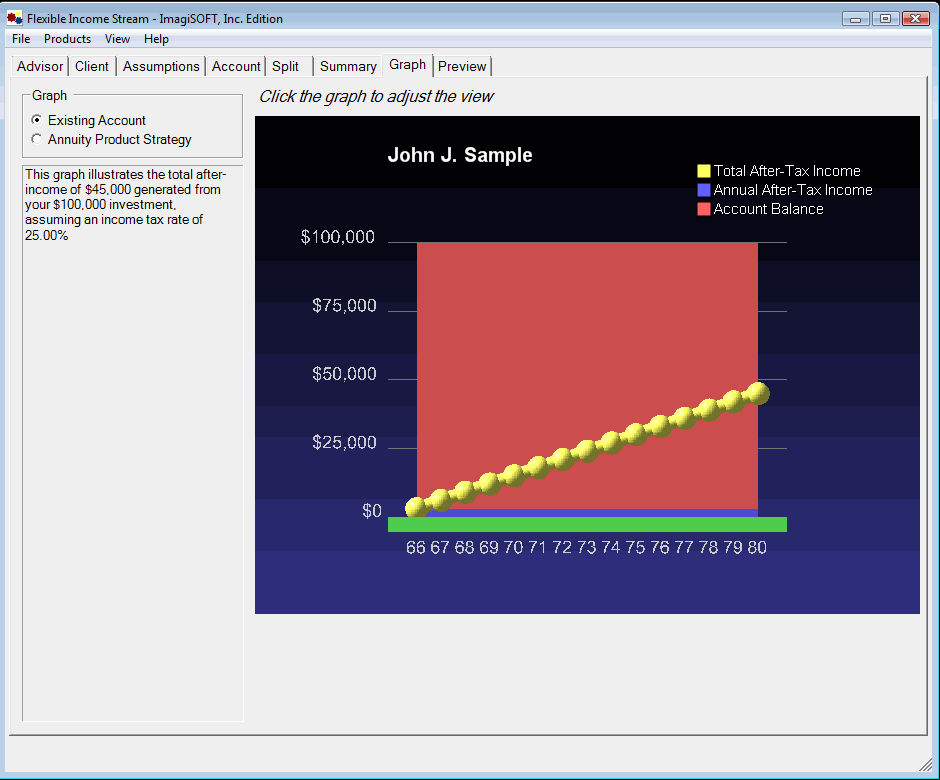
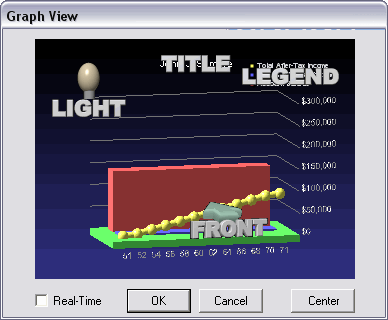
You can adjust the angle of the 3D graph by clicking on the graph:
- Move Graph: To orient the graph in a different direction, click on "Front" and, while holding down the mouse button, drag it to the desired location on the screen.
- Light: To cast light and shadows differently on the graph, click on "Light" and drag it to where you want it on the screen.
- Title: To move the title of the graph to a different location, click on "Title" and drag it to any point on the screen.
- Legend: To move the legend of the graph to a different place, click on "Legend" and drag it to the desired location on the screen.
- Real-Time: leaving this box checked will allow you to see the changes that you make to the graph as you drag icons around.
Un-checking the box will show you the changes you have made only after you have placed the icon in its new position (and release the mouse button).
 Back to top Back to top
|
|
|
Preview Tab
|
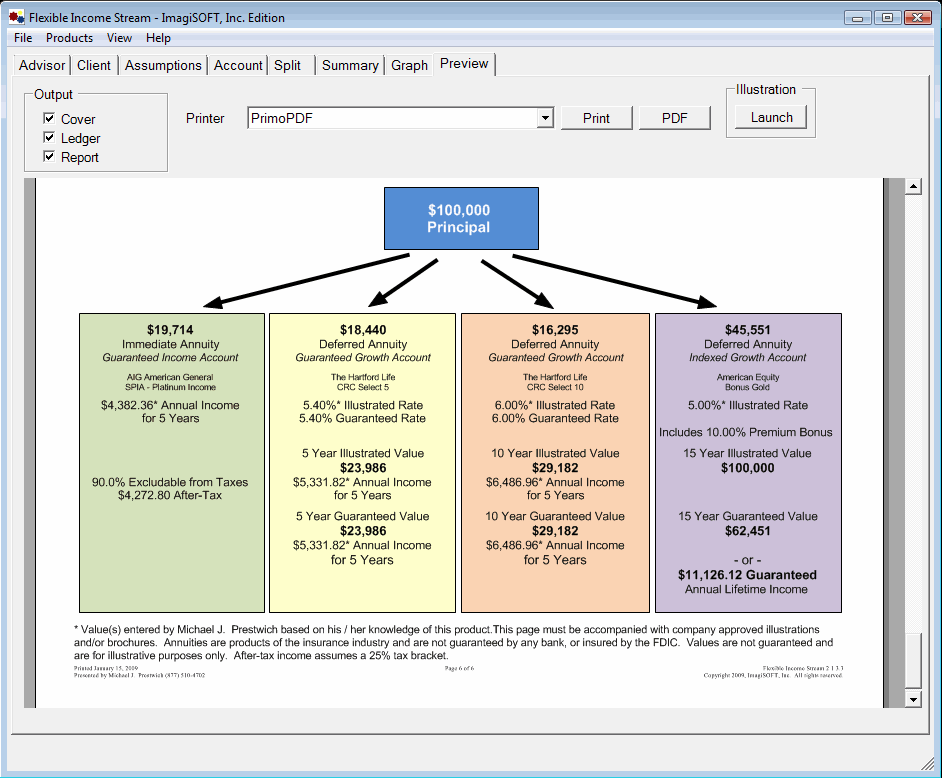
On the preview tab you can look over the pages of the
report, which can include the graph and all the information
you input in the previous tabs, before you save or print the
report. It uses charts and comparisons to help your client
evaluate his or her current projections.
- Output: by checking or un-checking any of the
boxes in the output area you can add or remove various
parts of the report. Check the box to keep that element
in the report, and un-check the box to remove it.
- Printer: choose which printer you want to use
to print the report.
- Print: clicking on this will send your report
to the selected printer.
- PDF: clicking on this will allow you to save
the report as a .pdf file, which you can open with Adobe
Acrobat Reader or another .pdf reader.
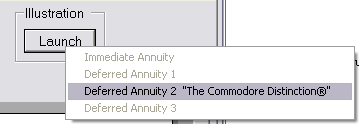
- Launch: clicking this will allow you to select and launch official illustrations
for any products for which
IMAGISOFT
has built the illustration system. If you would like an
official illustration added to the Flexible Income
Stream calculator, please contact the carrier and ask
them to talk to IMAGISOFT.
|
|
|
Back to top.
|
|
|


